The Analytics Edge Exporter GA4 allows you to automate the download of data from the Google Analytics Data API into simple comma or tab-separated files that can be read by virtually any application. There is no programming or knowledge of the APIs required; the query wizards use report-friendly field names and provide a simple, yet powerful capabilities to download and fine-tune your data into a report-friendly format.
With the exception of the Scheduling feature, everything described here is free and unrestricted.
A Quick, No-Code Query
Clicking on the button to start a new query, a wizard will pop open allowing you to select your account and web property. Adding a new account is easy — just click the button and follow the prompts to grant the app access to your account. You can add as many accounts as you like — they are stored, encrypted, on your computer and are only used for your API queries.
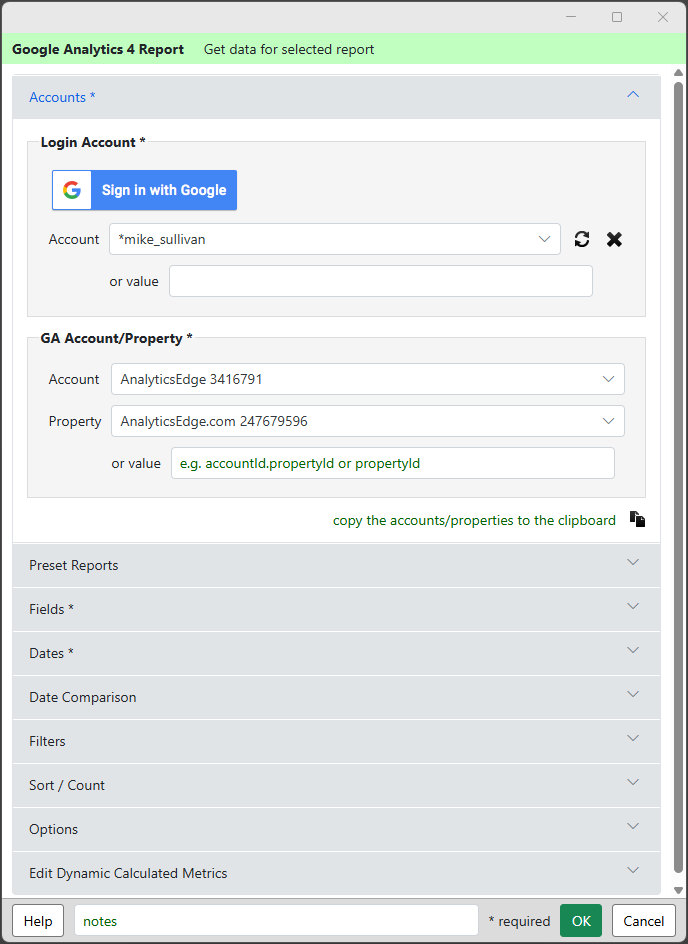
In the Preset Reports section, select a report to pre-populate the other sections with common settings. You can then change the settings to suit your specific reporting needs.

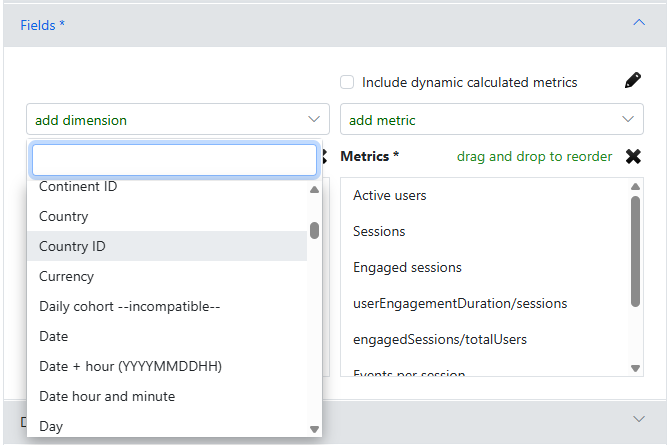
In the Fields section, pick the fields you want in your report. Selected fields appear in the lists, and they can be reordered or deleted as needed.
Note that Google Analytics has a lot of internal rules about what fields are compatible with other fields, and the connector will identify the –incompatible– fields in the list.
In the Dates section, pick a preset date range. Then click the OK button at the bottom. Your data will be returned to the app and displayed in a spreadsheet-like grid.
Another wizard will then pop open (Quick Functions) and prompt you to enter a file name, for example ‘session source-medium’.
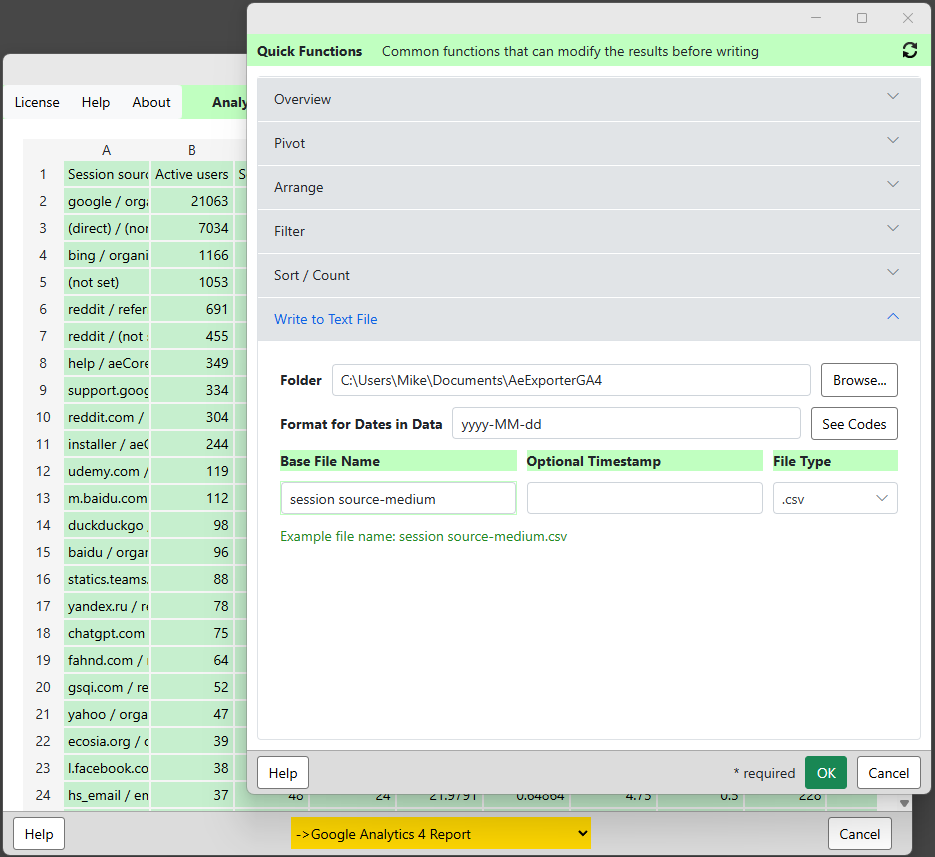
When you click the OK button at the bottom, the data will be saved to the file specified.
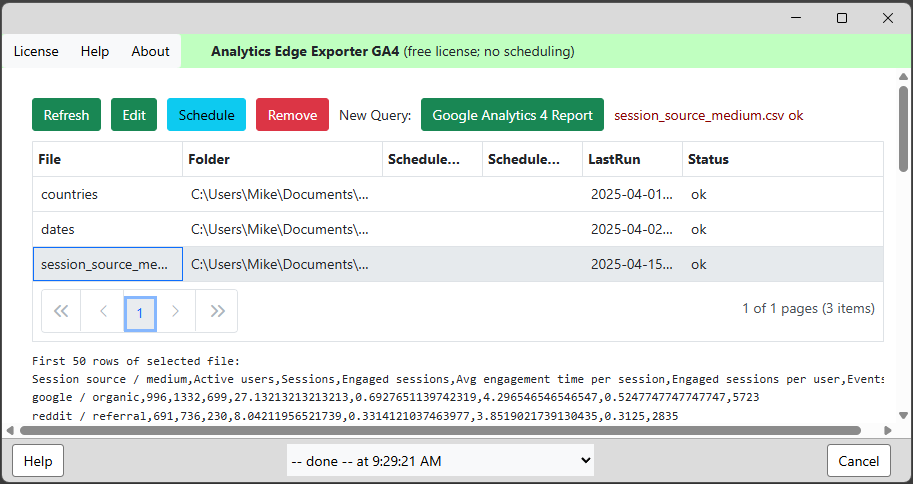
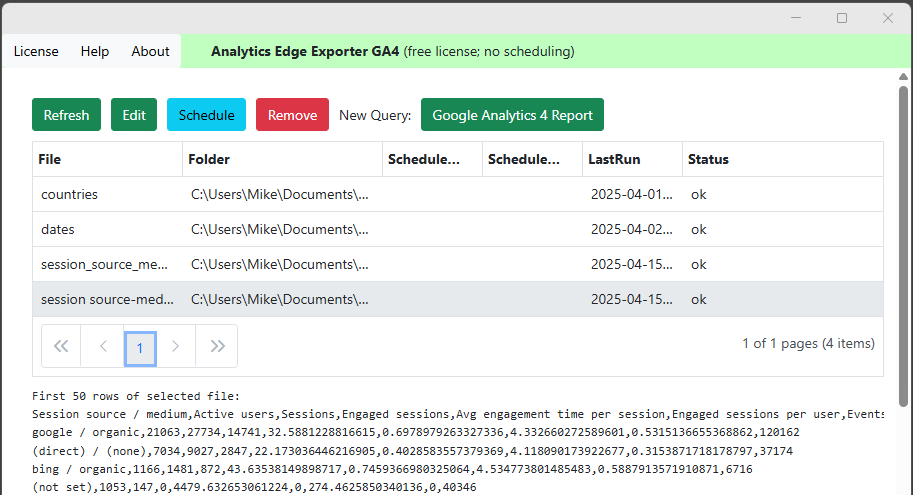
Selecting the file in the list will show a preview of the contents of the file. You can select one or more files and click the Refresh button to run all the queries and refresh the data in all of the selected files.
Or you can select a file and Edit to reopen the original wizard with all of your selections for a quick and easy change.
Features and Capabilities
Product Usage
Aside from the initial product license activation, there is no usage tracking in the product. It runs on your computer and makes direct calls to Google’s API server.
There is no limit to the number of queries you can run (subject to API rate limits).
There is no limit to the number of accounts you can use.
The app will automatically make multiple API calls to download all the data available for any query. There is no limit to the number of rows you can download (subject to what is available from the API).
CAUTION: if you make a lot of large queries leveraging the ‘minimize sampling‘ feature, you can hit daily or hourly API rate limits.
Field Selections
The product includes all the capabilities of the API and is updated as new capabilities are released.
You can also include dynamic calculated metrics that you can define farther down in the wizard.
Note: The minimize sampling option in the Options section lets you combine the results from multiple API calls. This lets you reduce the sampling by making multiple, shorter duration (down to daily), queries and joining them together. This option adds a column for the Nth Day, Week or Month as selected.
Date Ranges
You can select a preset date range, or specify the range using a combination of start date, duration or end date. You can make the dates relative to today or yesterday, last week or last month so that refreshes always get you the most recent periods.
Date comparisons can also be requested, letting you compare to the previous period or a specific date range. Optional difference and percent changed columns can be included.
Filter and Sort
You can filter by any compatible field and build a series of dimension and metric filters. You can also reference a worksheet cell to get a dynamic filter you manage there.
You can sort by any field in the query, and multiple sort rules will be evaluated in order. You can also restrict the results to the top N rows.
Formatting Options
Formatting options are available for date and time columns.
The minimize sampling option can be used if you are reporting on a high volume property over a long date range to reduce the errors due to sampling.
Dynamic Calculated Metrics
The product comes with a few example of calculated metrics, but you can add your own. While the formula must use API fields names, there is a dropdown selector to lookup the field names of metrics you want to use.
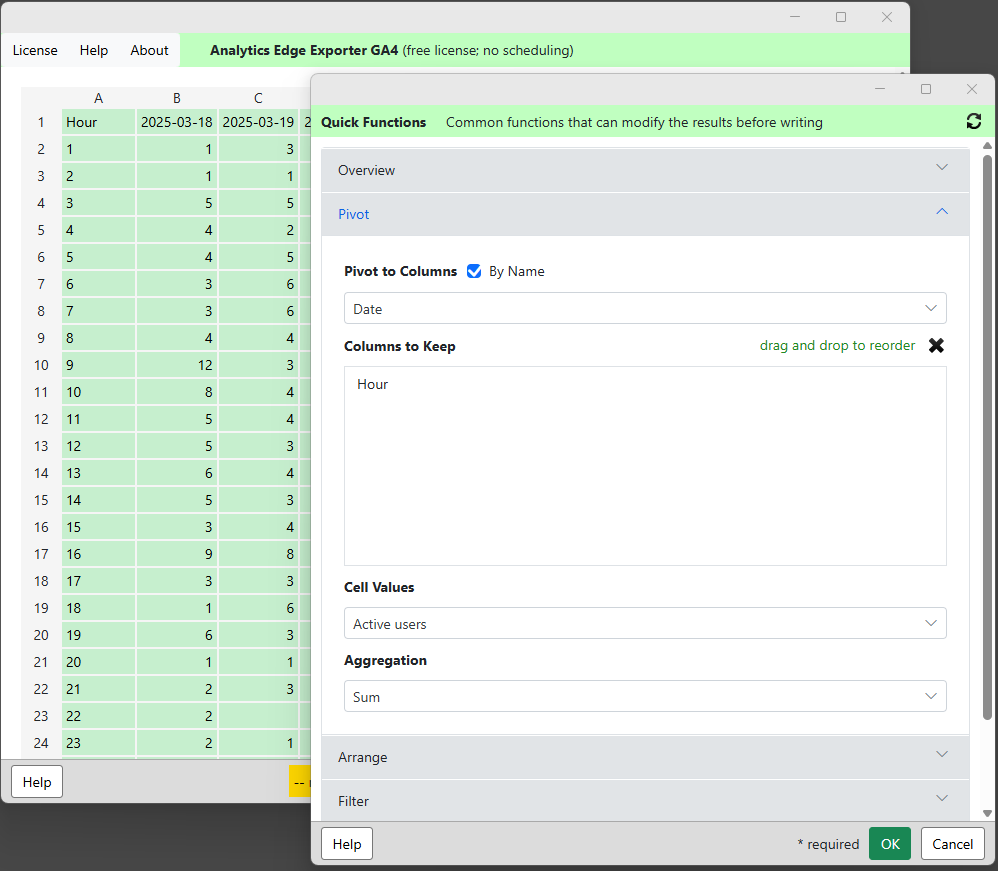
Quick Functions
After the query has run, you also get the opportunity to fine tune the results with pivot, arrange, filter, and sort functions. For example, you could easily pivot the Hour by the Date columns to get a table that is report-ready.
Optional Scheduled Refresh
With an annual paid license, you also get the ability to schedule the files to refresh automatically on your computer daily, week or monthly.
You are also provided with a command line string you can use to trigger a query refresh from another application or script.
With or without the paid license, you can refresh the queries manually by selecting the entry and clicking the Refresh button.
The Analytics Edge Exporter GA4 is available for MacOS and Windows computers — visit the Download page for your copy now!