Way back in 2014, I built a connector for the Analytics Edge Add-in for Excel that accessed data from the Google Analytics APIs. In today’s lingo, that was for Universal Analytics data. That connector evolved over the years, adding features and capabilities to make reporting easier.
When the switch to Google Analytics 4 happened, I added support for the new Data and Admin APIs. While I carried along many of the existing features, several more were added. What follows is a snapshot of the current capabilities and how I work with the various APIs to deliver the data. There is no code here – there are plenty of samples online; this document describes the challenges of working with the API beyond a simple query, and how I handled them.
Context
I need to point out a few things about the approach that I take when coding. First, I do not use the vendor-supplied SDKs (software development kits). I have found that they tend to create more work to integrate into my solution than just querying the API directly – my solution is very row-column oriented (it is an Excel add-in, after all), and the SDKs tend to be more object-oriented and structured. I work in the C# programming language.
I have worked on a lot of different APIs from different ecosystems that work in very different ways. I try to make the various connectors simple and easy to use while still providing as much of the API functionality as possible. Because of that, I do not necessarily take advantage of all that an API can provide.
I have also noticed that many APIs provide a base set of data, but to make it useful for reporting, you need to make multiple queries. While I do this in the code, I try to make it as transparent as possible to the user, because computers are supposed to do the work for you. For example, most APIs paginate their results, making it necessary to send multiple queries to get all the data available. I automatically make those multiple queries unless the user specifically asks for less.
Authorization scopes
When you set up the Google Cloud project to connect to the Data and Admin APIs, you need to pick the scope(s) you will set to grant access. You should pick the scope with the least privilege for your use case. In my case, simple reporting, I only needed the ‘/auth/analytics.readonly’ scope. Even at that level, the scope is classified as sensitive, so your project will need to be verified before you can release it to the public.
Google verification is fast…usually a day or two. If you don’t satisfy one of their conditions, it will get rejected, and if that happens you should read the documentation carefully and make sure you satisfy all their conditions before resubmitting. If you want to debate the rejection, include as much explanation in your submission as you can; don’t assume anything and remember there are real people reading what you submit and their default is to reject. They are protecting the rest of us.
Authentication
The Google Analytics APIs can use a user account (Oauth access token) or a service account (key file) to authorize queries. If you are a programmer building your own application, you can use the service account approach to make the coding a little easier. Since the Analytics Edge connectors are designed for multiple-account use, that forced me down the Oauth path.
While Oauth can be overwhelming the first time you see it, it is actually quite easy to work with. The hardest part for me was getting the returned security code; Oauth opens a browser for the user to login, and sends the resulting security code (access token) to a previously-authorized web address (a redirect URL). I have a desktop app with no server component, so I have to start up a local web listener to receive the code. It is typically addressed as ‘http://127.0.0.1’ or ‘https://localhost’ but the Windows desktop sometimes includes local security/firewall settings that would require administrator privileges to start a listener.
There is a hole in Windows security, though, created by Microsoft to support WCF, so ‘http://localhost:80/Temporary_Listen_Addresses/’ will usually work even if you don’t have admin privileges. With that obstacle overcome, I get an access token [store it securely – I encrypt them].
Getting the data
To make a query, use the Data API ‘runReport’ method with the desired parameters. You get back a response with dimension and metric headers as well as rows of data and some other information…in structured JSON. I turn that into a table of rows and columns, and hold that other information for a bit. There are a few challenges in this seemingly simple step:
- Since the headers are sent separately from the row values, you need to align them in order
- Dimensions can be dates, numbers or text, and may be empty(!)
- Dates don’t exist as a data type in JSON; they are sent as text structured in the ‘20241231’ format (in this API response), so you will need to convert if you want an actual date
- Some metrics are time values, expressed in seconds; if you want to format them as time in a spreadsheet, you need to divide the number by 86400 (the number of seconds in a day) – the metric headers will tell you what type of metric they are
Getting all the data
You now have a table of data but the API might have more data available than it sent you. You need to check that ‘other information’ for the rowCount, and see if you have it all. If not, you need to make another query, setting the ‘offset’ and ‘limit’ parameters accordingly.
By the way, you can ask for up to 250000 rows at once (the limit), but you might experience a pause that is long enough for a user to question if the program is frozen, at which point they do something undesirable, like cancelling it (which doesn’t actually cancel the API query…it just ignores the response). I have found 50000 rows is a sweet spot…short enough that you can provide feedback that progress is being made before they start questioning.
What to do with the ‘other information’
You are at a point where you need to decide if you want to do anything with the other information provided by the API. Many APIs, like this one, are designed to feed interactive reports with a user interface, like a mobile reporting app. In my case, I just wanted the data table, but if you want to use the totals, maximums or minimums provided, you will need to extract them, too.
There is also some metadata provided, which includes sampling information. There is also information about the remaining API quotas…which you should pay attention to. Note: I do not use all the information available from the various APIs – I select the data appropriate to my application; you may find value where I didn’t. I report the key sampling and quota results in my status log.
API Quotas
Speaking of quotas, look up the quotas for the API method you are using. Make sure your code doesn’t run too many queries at once (concurrent), too many in an hour, or too many in a day. That may involve rate limiting or simply aborting the query depending on your application.
Most importantly, if you hit an error message, STOP all processing – the quota for errors is very small (~10/hr) and you could find yourself locked out for an hour. This is an important item, and you need to remember it as you continue to enhance the solution. As you will see below, I run multiple queries at once, and they run in a loop which runs in another loop. When you think you are finished coding, go back and make sure you abort gracefully in the event of an error.
Errors and robustness
As you start making lots of queries, you may find you hit an error causing an abort. If the error was a rate limit, maybe you shouldn’t abort, but instead pause for a period of time, then try again. You will inevitably also experience the dreaded 500 or 503 server errors when it isn’t your query at fault – Google’s API servers can get overwhelmed, especially when the first of the month is a Monday. In this case, you may want to pause briefly and try again. I do not recommend retrying more than once — people’s patience will ‘timeout’ before the code does and the error quota is very small.
Field names and metadata
Now that you have some data, you will realize that the column names are API field names…not exactly report-friendly. The Data API also has a method ‘getMetadata’ that lets you get the report-friendly field names for the dimensions and metrics in a specific property. Now you can create a report that looks just like the GA4 exploration reports!
Of course, since the API is in alpha/beta still (yes, there are 2 versions, they are still releasing changes), the field names may change over time (be deprecated). The metadata response also includes information about the old field names and maps to the new ones, so you can auto-update your queries and/or warn the user about the use of an old field name.
The metadata also includes any custom fields and calculated metrics in a specific property, and that is something you can use to populate a field selection when composing your query. Set that thought aside for now.
Dealing with data sampling
Now that we can reliably get all our data, we need to address the big problem in GA4 reporting – data sampling. Ask for too much data, and you get a statistically sampled response. The easiest way to deal with that is to make multiple, smaller queries.
I have seen lots of approaches to this over the years, and the easiest for people to understand is to split the query by month, week or even daily, and join the results together. One problem with that approach is that it is not immediately obvious which option you selected from the data. In my implementation, I prepend a manufactured column for the Nth Month, Nth Week, or Nth Day to correspond with the query number in the sequence, so the user can immediately see the results are based on individual queries and merging the results doesn’t produce seemingly duplicate rows with the same dimensions but different metrics.
Sigh, it’s really slow now…
You are just starting to feel good about this approach until you do that first annual report split by day and need to wait through 365 queries (with additional row queries and automatic error retries). The initial query, additional row queries, and automatic retry must happen in sequence, but there is nothing stopping you from running all 365 ‘day’ queries in parallel, is there? Uh, yes there is…they have a quota for that: concurrent queries (~10). So you have to build a loop that can issue a limited number of queries at once and wait for the individual responses before you start more. And don’t forget to abort the whole thing if you hit an error!
Additional layers of functionality
One very common reporting request is to compare 2 date ranges, and the Data API has a way to do that – simply including 2 date ranges in the request – but it produces a single response with both sets of data [and takes longer to run]. Now, if you are like me, having just finished building that nice, robust, responsive, multi-threaded query engine, you might think it is easier to just make 2 queries (in parallel) and join/compare the results rather than mess with something that works. I also added some comparison logic (delta, percent change) as well; I already had an add-in with lots of functions like that, so it was easy for me.
Another common request is to report on multiple properties at once. Again, just feed the individual property queries into the query engine and merge the results with a manufactured column or two identifying the property. You can get the property ‘name’ from the Admin API (more on this later).
Calculated metrics (2023)
A feature added to GA4 in late 2023 was the ability to create calculated metrics, and Google brought this to the API in 2 ways: they exposed the calculated metrics from the property in the metadata so you could use the existing fields, and; they made it possible to specify a calculation right in your API query parameters.
Enabling the second option, dynamically calculated fields, would mean you need a list of local calculations with pretty names to use in your report columns. That lets your re-use the calculations across queries and properties.
New (alpha): annotations (2025)
A feature added to GA4 in early 2025 was the ability to add annotations to a property – notes linked to a date with an associated color. Because they are date-specific, showing an annotation in an existing report requires a date column. It also requires a separate Admin API query to get the annotation data.
The ‘reportingDataAnnotations’ method is only in the alpha API at this time, and when you try to build a report with it you immediately realize there are a few things you probably didn’t know about annotations:
- Annotations can be specified with a date or a date range, each with year, month and day values
- The year could be zero (an anniversary)
- The month and day could be zero (all year)
- The day could be zero (a credit card expiry)
Those various options need to be considered when mapping to a date column in your report.
Building the query: property selection
Running the query is only half of the battle – you need to construct the query first. Before we talk about properties, let’s talk about accounts. There is the account you login to, and then there is the GA account that contains your properties. When you get a security access token, it is for your login account, and it may grant you access to multiple GA accounts and their respective properties. The GA accounts and properties have id numbers that are used in the queries – they appear in the web application below the names:
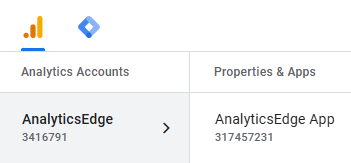
Since people don’t identify with property id numbers, you will need to cross-reference from the names to the ids. The Admin API has an ‘accountSummaries’ method. It contains a list of the GA accounts your login account has access to, and each GA account contains a list of properties. From this hierarchy, you can extract the names (displayNames) and ids for all the GA accounts and properties available to you.
Building the query: field selection
For an end-user product, it will need a good field dimension/metric selection capability. GA4 has a lot of rules about what fields can be used with other fields, which they don’t publish. They do provide a ‘checkCompatibility’ method in the Data API to help. You should know that it includes any custom fields defined in the property, which is a bonus.
Feed it the existing dimensions, metrics and filters already selected, and it will tell you what dimensions and metrics are compatible. That becomes an iterative process, after each selection, go get the compatible fields. This applies to the filters as well.
Filters are fun! Not…
Speaking of filters…take your time with the structure. Let me summarize what you will find in the click-click-click-click hierarchical linking in the documentation:
- A dimensionFilter or metricFilter is a FilterExpression
- A FilterExpression could be an andGroup, orGroup, notExpression or filter
- An andGroup or orGroup is a FilterExpressionList
- A FilterExpressionList is a list of FilterExpression (yes, this is #2)
- A notExpression is a FilterExpression (yes, this is also #2)
- A filter can be one of {stringFilter, inListFilter, numericFilter, betweenFilter or emptyFilter} plus a fieldName
I found it easiest to build a filter expression from the bottom and work up.
- For the dimensions, build the individual filter expressions
- If needed, wrap a filter in a notExpression
- According to your filter logic, combine multiple filters or notExpressions into an andGroup or orGroup
- Repeat 2 and 3 until you have something to put into the top level dimensionFilter
- Repeat 1 thru 4 for the metrics – put it into the metricFilter
sidenote: the free Analytics Edge Exporter GA4 has a built-in filter generator — in the Filter section, add the various filters and click the Copy button at the bottom to copy it to the clipboard.
Don’t forget the dates
I don’t use the multiple date range capability of the Data API ‘runReport’ method, so I simply specify the start and end dates for the query. This is a case where the user sees functionality that doesn’t exist in the API – it is a value-added feature of the application.
Most reporting interfaces support a variety of date range options like ‘last 28 days’, so this is an expected convenience you need to consider in your application. In the user interface, I provide multiple methods to select the date range, including preset ranges, as well as various durations and ways to specify the start/end dates. Behind the scenes I convert all of them to a start and end date for the queries.
End notes
The Google Analytics APIs are solid and relatively easy to work with. A lot of the extra work I have done over the years is to adapt them to my specific use case: simple tabular reporting. Sending a query to the API is easy; creating a fast, responsive, robust solution takes a bit more work. I hope this article gives you a few ideas on how to make your own implementation a little better.
If you want to reach out to me, I am available on LinkedIn and Bluesky.
If you want to see it all in action, the Analytics Edge Exporter GA4 is free; it extracts the data into comma-separated (CSV) files and can be scheduled or run from a command line. That would make it a lot easier to implement than writing your own code.